Skip to content
House Roadmap
Get quotes

Home upgrades in East Riding of Yorkshire

East Riding of Yorkshire has more bungalows than almost anywhere in England: 17.6% of its homes, against 8.6% for the typical English council, 29th highest of 296. Most of its about 152,100 households own their home, 70% of them, so the decisions are largely yours to make. And there's more to gain here than in most places: the certificates' estimate of a year's energy is £1,110 per home, well above the typical council's £1,004.

households
152,100householdsDESNZ, 2024
median rating
D · 67median ratingJoint 66th lowest of 361
rated C or better
45%rated C or betterThe middle council: 48%
have a certificate
80%have a certificateRegister to 9 September 2026
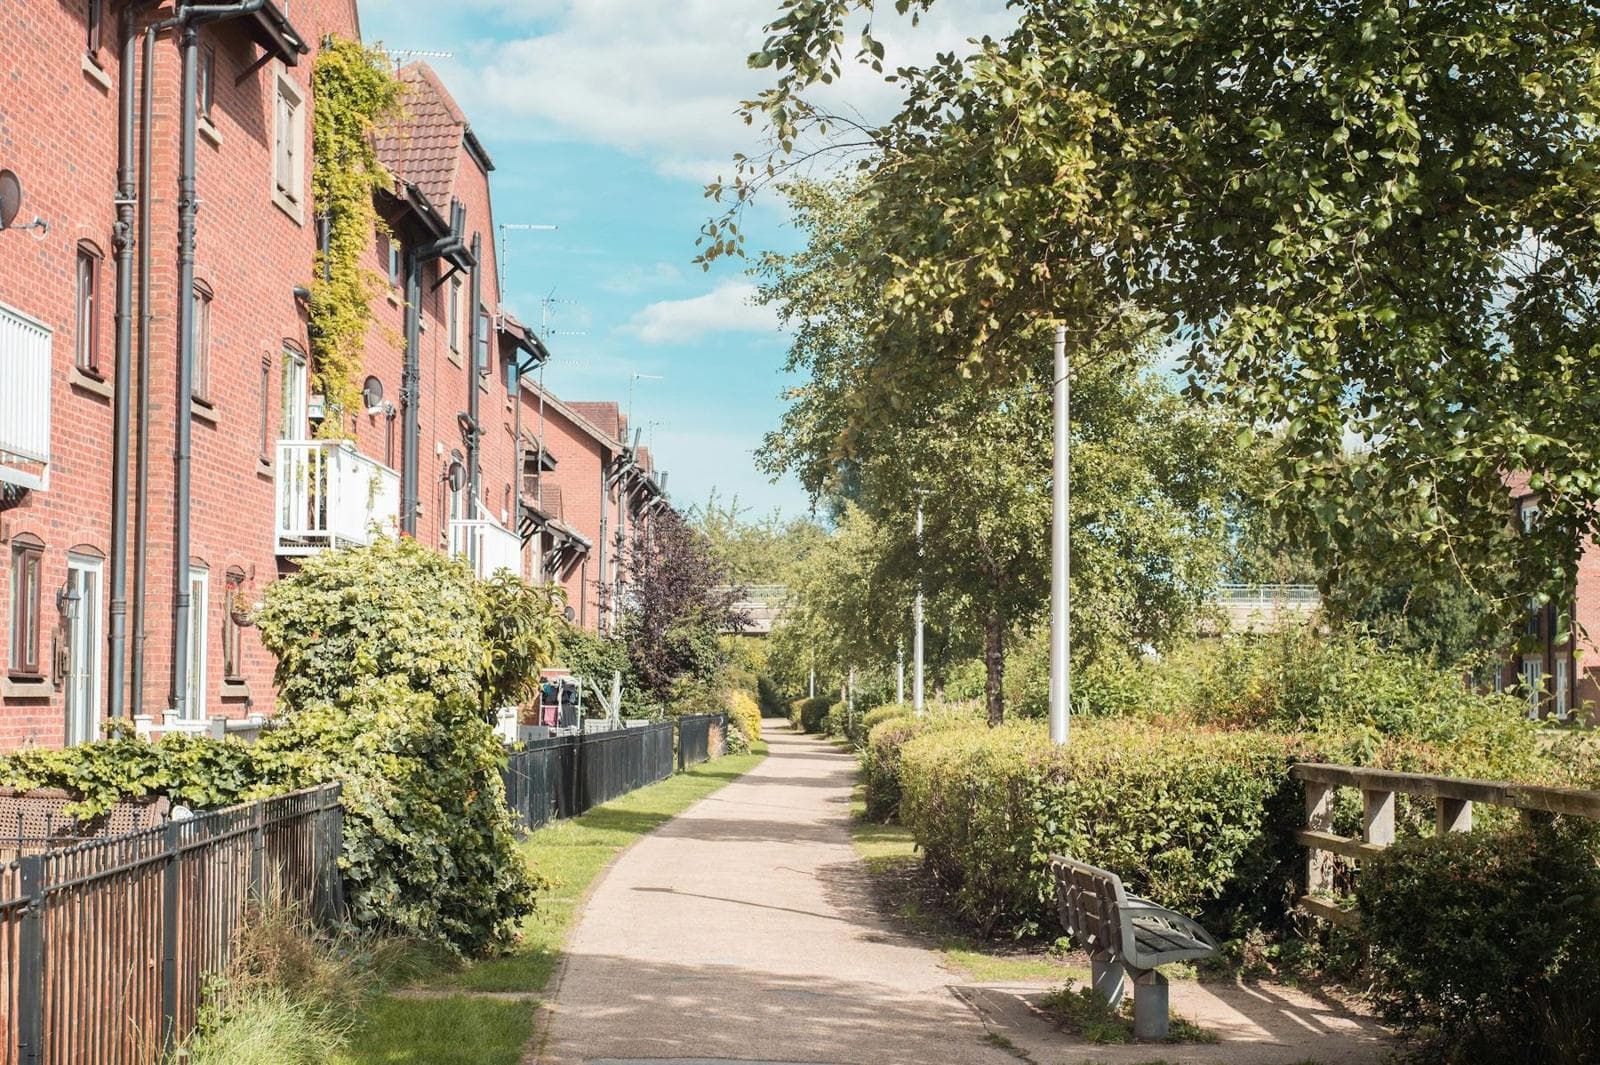
A path running past modern brick townhouses with balconies, beside trees and hedges on a sunny day
Beverley. Photo: Liam Riby, Unsplash
  • 18%Bungalows52nd highest of 361 councils
  • 8.3Conservation areas per 10,000 households41st highest of 296 councils
  • £1,110Energy cost a year, per home71st highest of 361 councils

What sets it apart

What makes East Riding of Yorkshire different

Of every measure we hold for the UK's councils, these are the ones where East Riding of Yorkshire sits furthest from the middle, and what each means if you live here.

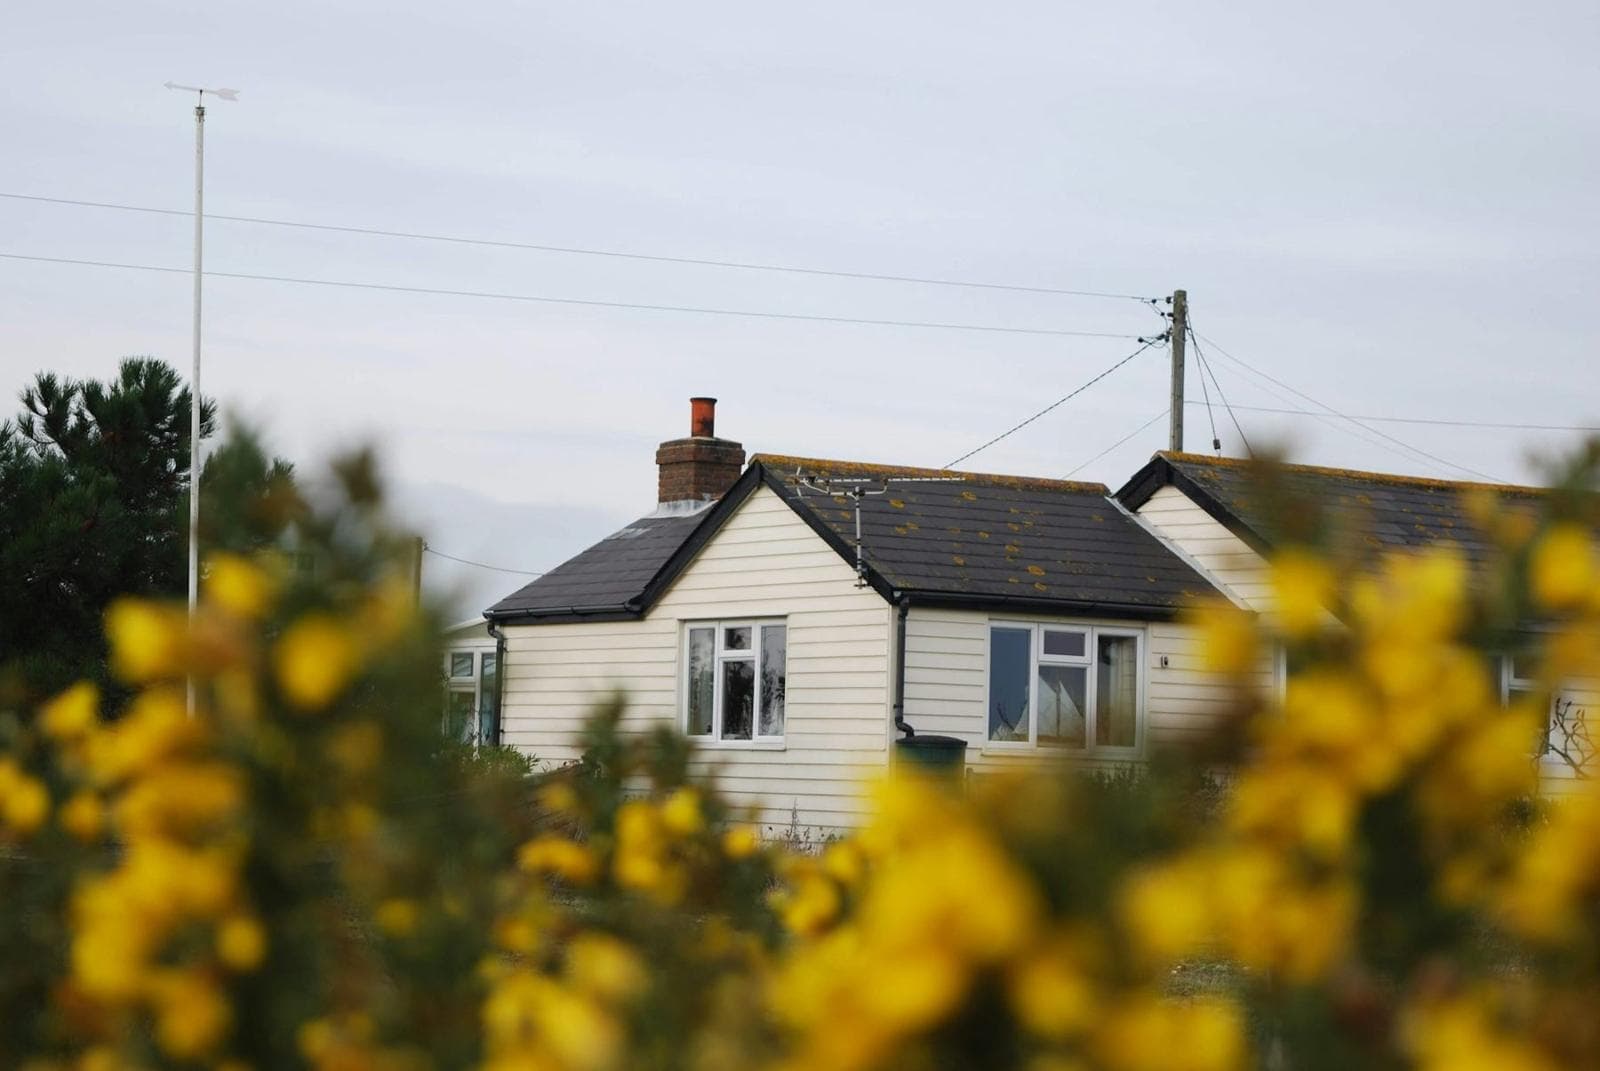
A white weatherboarded single-storey house seen past yellow gorse

Bungalows

18%

52nd highest of 361 UK councils

Type of home

A bungalow's loft matters most

About one home in six here is a bungalow, around twice the typical council's share. A bungalow has a lot of roof for its floor area, so the loft does much of the work of keeping the heat in. Only 16.3% of lofts in the East Riding have under 100 mm, fewer than most, so many are done; if yours is one of the rest, it's the cheapest job on the list. North Lincolnshire, across the Humber, has a similar share of bungalows at 16.9%.
  1. East Riding of Yorkshire18%
  2. North Yorkshire14%
  3. Hull6.9%
  4. The middle UK council9%
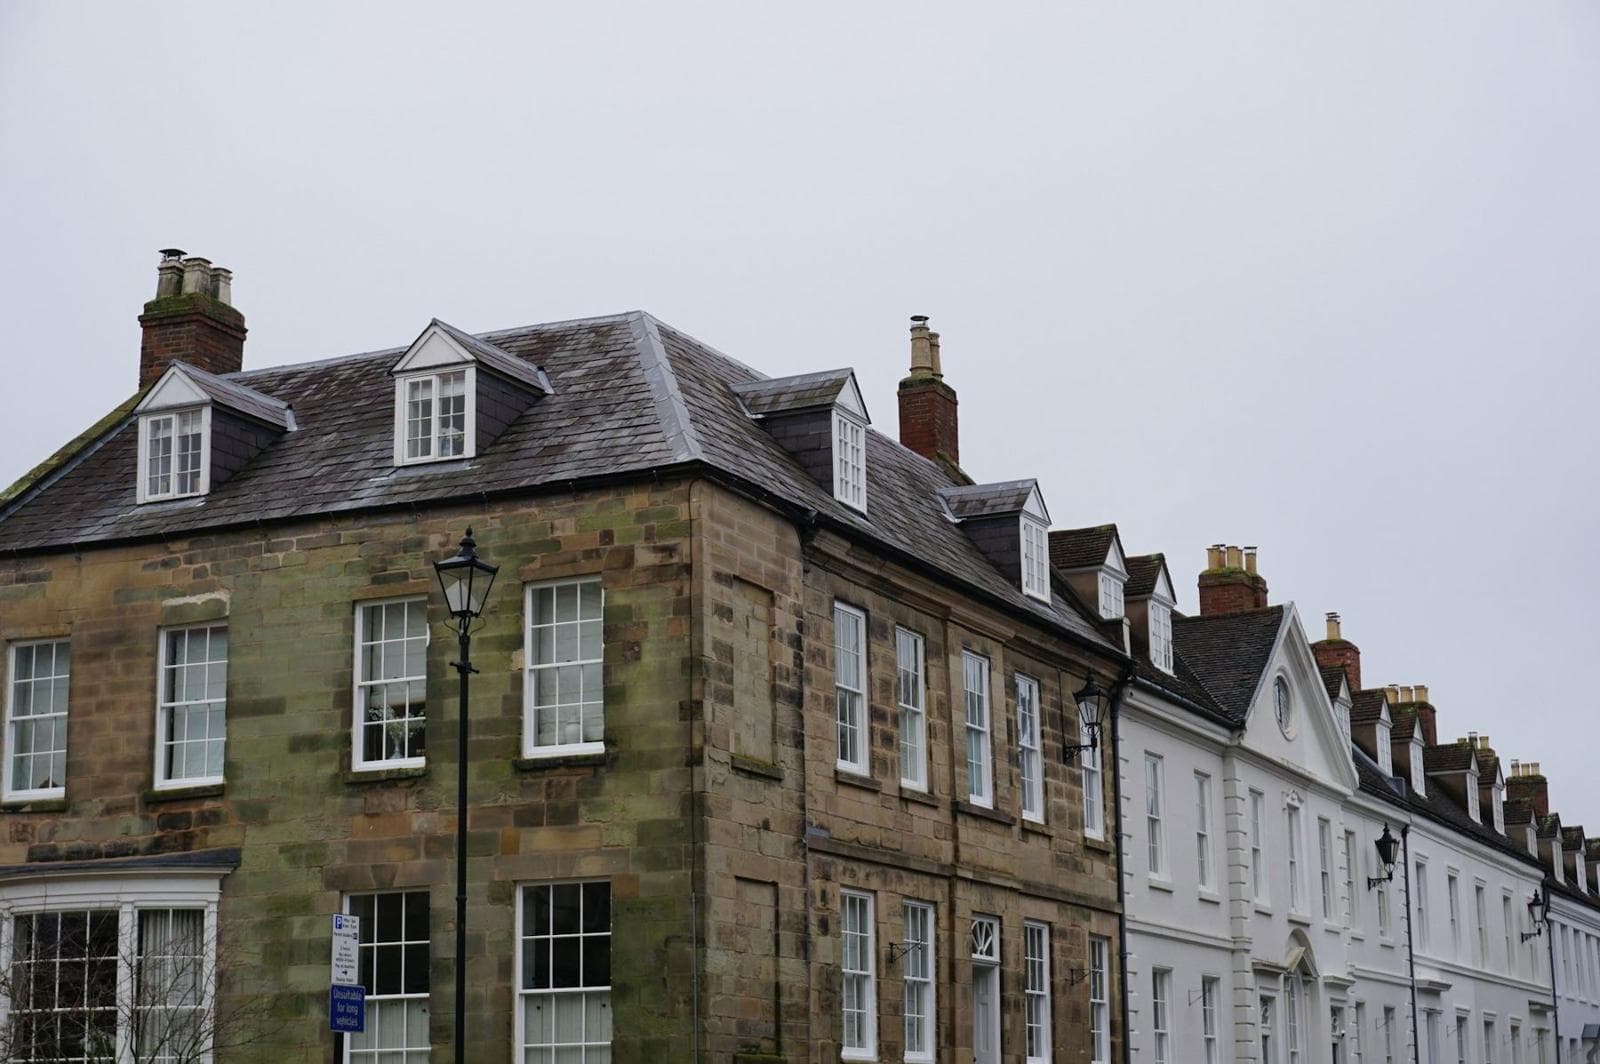
A row of Georgian stone and white-painted townhouses with dormer windows under a pale sky

Conservation areas per 10,000 households

8.3

41st highest of 296 UK councils

Planning

Check for a conservation area

The East Riding has 8.3 conservation areas for every 10,000 households, more than twice the typical council's 3.8, and more than any neighbour except North Yorkshire, with 9. Most heat pumps, solar panels and insulation still need no application. But in a conservation area the rules on anything visible from the street are tighter, so check before you book an installer.

  1. East Riding of Yorkshire8.3
  2. North Yorkshire9
  3. Hull2.3
  4. The middle UK council3.8
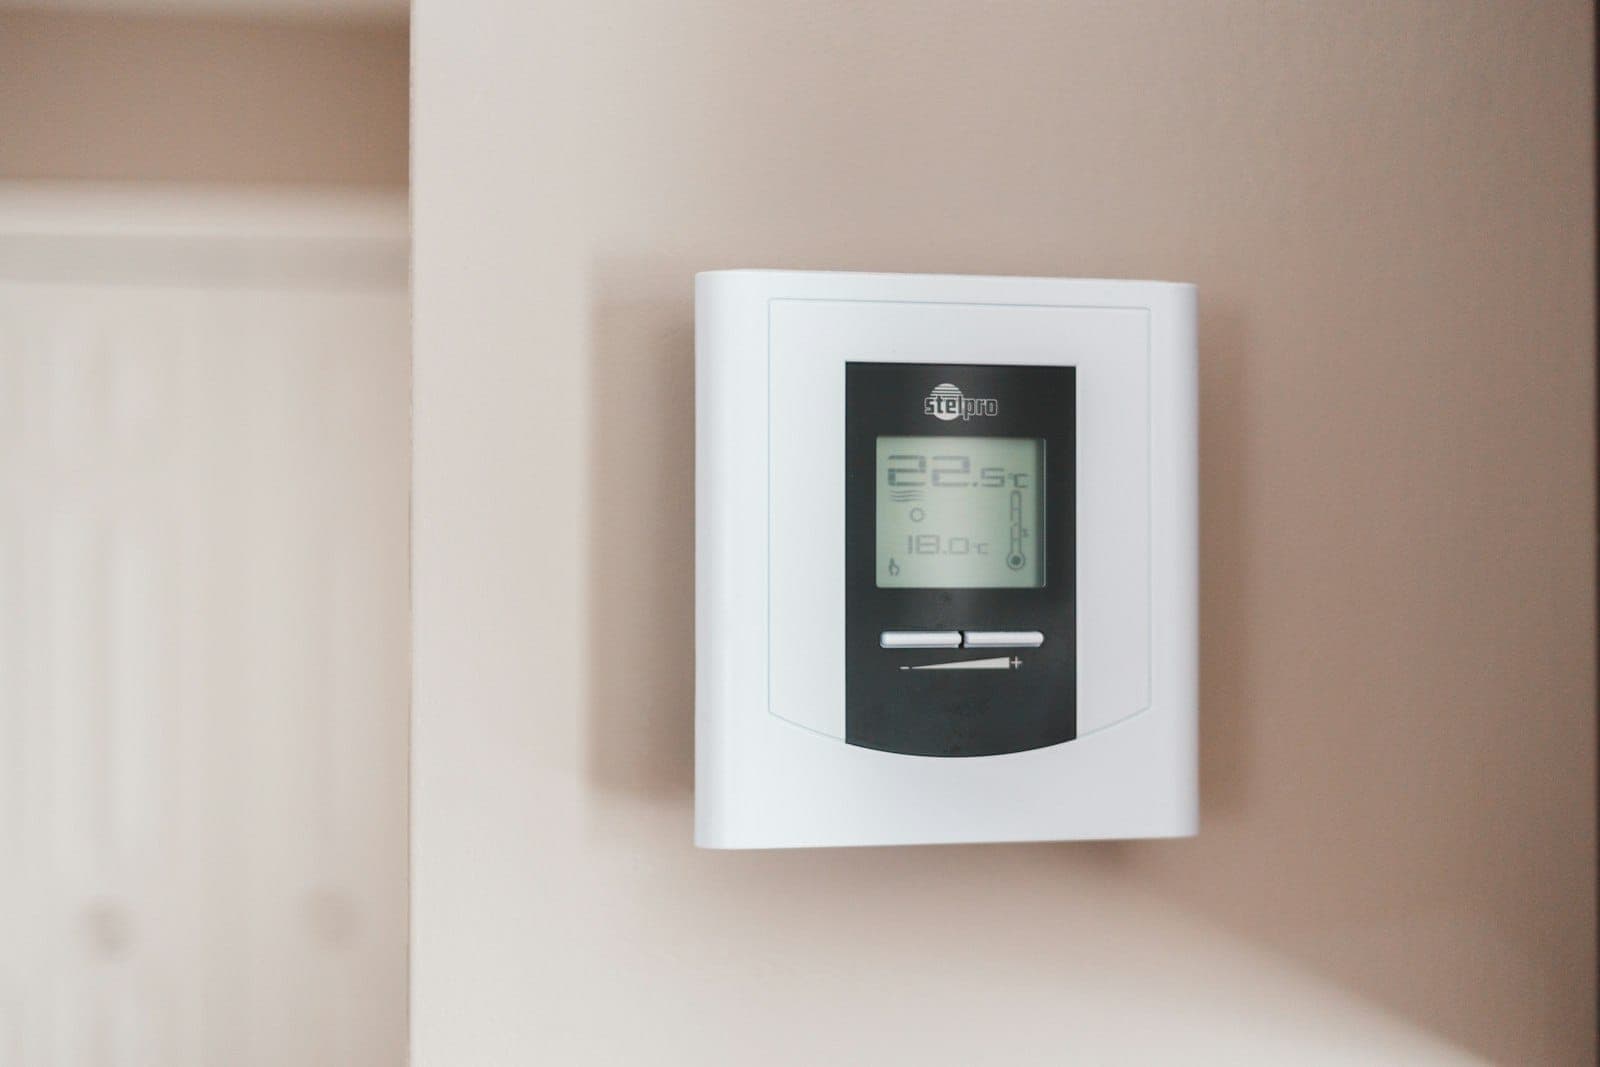
A white digital room thermostat on a pale wall, its screen reading 22.5°C with 18.0°C beneath

Energy cost a year, per home

£1,110

71st highest of 361 UK councils

Running costs

More to gain than most

The certificates' estimate of a year's energy here is £1,110 per home, well above the typical council's £1,004, though below North Yorkshire's £1,239. More detached homes and more oil heating than most councils help explain it: 34.9% of homes are detached and 5.8% use oil. If yours is one of the 17.1% off the gas grid, the heating is usually where the biggest gain lies.

  1. East Riding of Yorkshire£1,110
  2. North Yorkshire£1,239
  3. Hull£906
  4. The middle UK council£1,004

Against the rest

Where East Riding of Yorkshire sits among 361 councils

The measures where East Riding of Yorkshire sits furthest from the middle. Each strip runs from the lowest council in the UK on the left to the highest on the right, in tenths, and the marked tenth is East Riding of Yorkshire. The green cards are its standouts.

  • Type of home

    Bungalows

    18%

    52nd highest of 361. The middle council: 9%.

  • Planning

    Conservation areas per 10,000 households

    8.3

    41st highest of 296. The middle council: 3.8.

  • Running costs

    Energy cost a year, per home

    £1,110

    71st highest of 361. The middle council: £1,004.

  • Planning

    Decided in time

    99%

    Joint 15th highest of 296. The middle council: 93%.

  • Who owns it

    Socially rented

    12%

    Joint 49th lowest of 361. The middle council: 17%.

  • Type of home

    Flats and maisonettes

    12%

    Joint 50th lowest of 361. The middle council: 21%.

  • Walls, lofts and windows

    Cavity walls left empty

    18%

    61st lowest of 361. The middle council: 26%.

  • Who owns it

    Owner-occupied

    70%

    Joint 74th highest of 361. The middle council: 64%.

Show all 28 measures
The rest of East Riding of Yorkshire's measures, with where each ranks among UK councils
MeasureEast Riding of YorkshireThe middle council
Median EPC score6768
Rated C or better45%48%
Built since 200323%20%
Built before 193018%18%
Terraced30%37%
Detached35%28%
Privately rented18%18%
Lofts under 100 mm16%20%
Solid walls uninsulated89%88%
Some single glazing8.1%8.4%
Heated by oil5.8%1.1%
Heat pump grants per 10,000 households5031
Heated by electricity8.5%11%
Heat pumps per 10,000 homes212125
Off the gas grid17%14%
Solar installations per 10,000 households702596
Solar yield, south-facing roof978 kWh1,006 kWh
Hours of sunshine a year1,556 hours1,548 hours
Saving if the certificates' advice were done£278£245
Planning applications approved90%89%

Housing figures are from each nation's EPC register, whose assessors don't all work to the same method, so comparisons across a border are rougher than those within one.

Next door

East Riding of Yorkshire against its neighbours

The councils that share a border with it, on the measures East Riding of Yorkshire stands out on, and the middle council in the UK for scale.

Map of East Riding of Yorkshire and the councils around it, each shaded by the median energy rating of its homes.North Yorkshire: median DHull: median DNorth Lincolnshire: median DYork: median DDoncaster: median DEast Riding of Yorkshire: median D

East Riding of Yorkshire

© OpenStreetMap contributors

  • A
  • B
  • C
  • D
  • E
  • F
  • G
East Riding of Yorkshire, outlined, and the councils around it, each shaded by the median rating of its homes on the EPC register.
East Riding of Yorkshire and the councils around it, on the measures it stands out on
CouncilBungalowsConservation areas per 10,000 householdsEnergy cost a year, per home
East Riding of Yorkshire18%8.3£1,110
North Yorkshire14%9£1,239
Hull6.9%2.3£906
North Lincolnshire17%2.3£1,058
York11%4.1£1,007
Doncaster14%2.8£1,002
The middle UK council9%3.8£1,004

What the neighbours show

The East Riding wraps around Hull, and the contrast is sharp: Hull has 26 heat pumps per 10,000 homes and 327 solar installations per 10,000 households, where the East Riding has 212 and 702. Against its other neighbours it sits in the middle, behind North Yorkshire on heat pumps and North Lincolnshire on solar, and ahead of York on both.

The housing

What East Riding of Yorkshire is built from

This is a county of houses rather than flats: only 12.2% of homes are flats, and 34.9% are detached. 69.6% are owner-occupied, 74th highest in the UK, so most households can decide on work for themselves. Just 12.1% are socially rented.

When it was built

Share of homes by construction period.

  • Before 19008%
  • 1900-192910%
  • 1930-19499.5%
  • 1950-196613%
  • 1967-197511%
  • 1976-19826.5%
  • 1983-19906.6%
  • 1991-200211%
  • 2003-20117.4%
  • 2012 onwards16%

Anything built before 1930 is almost certainly solid walled. Anything after 1990 has insulation in the cavity as built.

What type of home

Share of homes by property type.

  • House70%
  • Bungalow18%
  • Flat11%
  • Maisonette0.9%
  • Other0%

Flats are the hardest to improve: no roof of your own, nowhere for a cylinder, and a freeholder in the way.

How it is joined to its neighbours

Share of homes by built form.

  • Semi-detached35%
  • Detached35%
  • Mid-terrace18%
  • End-terrace11%
  • Other1.1%

Every shared wall is one that loses no heat, which is why a mid-terrace needs a smaller heat pump than a detached house of the same floor area.

How it is heated

Share of homes by main heating fuel.

  • Mains gas83%
  • Electricity8.5%
  • Oil5.8%
  • LPG1.4%
  • Other1.8%

Off-grid homes on oil or LPG pay the most per unit of heat, and gain the most from changing the system.

Who lives there

Share of homes by tenure, as the certificate recorded it.

  • Owner-occupied70%
  • Rented (private)18%
  • Rented (social)12%

Owners decide for themselves; tenants need a landlord to agree, and social landlords upgrade in whole estates. 24% of certificates don't say, and are left out.

What the walls are

Share of homes by wall construction and insulation.

  • Cavity, filled48%
  • Cavity, partly filled2.1%
  • Cavity, empty8.6%
  • Solid, insulated2.5%
  • Solid, uninsulated20%
  • Built to a modern standard16%
  • Timber, system built or other2.5%

An empty cavity is the cheapest big fix in the country. A solid wall can only be insulated inside or out, at many times the price.

What is over the top floor

Share of homes by roof, and loft insulation depth.

  • Loft, no insulation6.8%
  • Loft, under 100 mm5.4%
  • Loft, 100 to 199 mm18%
  • Loft, 200 mm or more40%
  • Loft, depth not recorded4.9%
  • Flat roof, roof rooms or thatch3.4%
  • Built to a modern standard16%
  • Another home above6.1%

Current guidance is 270 mm in a loft. Anything under 100 mm is worth topping up before anything else.

From the EPC register to 9 September 2026: 122,214 homes with a certificate, each counted once from its latest. Homes that have never had one aren't included, and unknowns are left out of the shares.

Planning

How East Riding of Yorkshire handles applications

Most heat pumps, solar panels and insulation need no planning application at all. The East Riding is among the quickest councils to decide those that do, with 99% decided in time, 15th highest in England, and it approves 89.5% of applications of every kind.

A row of Georgian stone and white-painted townhouses with dormer windows under a pale sky
  • Applications approved

    89.5%

    The middle council: 89.2%

  • Decided in time

    99%

    The middle council: 92.6%

  • Householder decisions

    830

    In the year ending March 2026

  • Conservation areas

    126

    Where solar, cladding and windows need more care

The nation's planning statistics for year ending March 2026, every kind of application. Conservation areas are from the Planning Data platform, England only. What needs permission.

What needs doing

What the certificates in East Riding of Yorkshire say

The certificates find the East Riding ahead on the cheap jobs: only 18.2% of cavity walls are empty, against 26.2% for the typical council, and lofts are better than most. Solid walls are another matter, with 88.9% uninsulated, and 8.1% of homes still have some single glazing. Doing all their advice would save £278 a year per home on their estimate, 87th highest of 361.

  • Cavity walls still empty

    18.2%

    Against 25.9% across England and Wales

  • Lofts under 100 mm

    16.3%

    Against 22.1% across England and Wales

  • Any single glazing

    8.1%

    Against 10.7% across England and Wales

  • Off the gas grid

    17.1%

    Against 16.1% across England and Wales

What the certificates recommend

Share of homes whose latest certificate recommends each measure.

  1. Solar panels82.2%
  2. Solar water heating68.3%
  3. Floor insulation55.3%
  4. Low energy lighting38.6%
  5. Solid wall insulation22%
  6. Condensing boiler22%
  7. Heating controls18.1%
  8. Cavity wall insulation13.1%

A certificate recommends what would raise its rating, which isn't always what would save the most. Older certificates recommend by older rules.

Heating, hot water and lighting

£1,110a year, on average

Today
£1,110
All done
£832
With every recommendation done
£832
Difference
£278 a year
England and Wales average
£981

The certificate's own estimate, at standard occupancy and at the fuel prices its method used when it was lodged, not today's prices or anyone's actual bill.

From the EPC register to 9 September 2026, each home's latest certificate. Walls, lofts and glazing are as the assessor found or assumed them, so work done since a home's last certificate doesn't show.

Ratings

How East Riding of Yorkshire's homes rate

The median East Riding home scores 67, band D, one point under the typical council, and 45.3% are rated C or better against 48.1% across the UK. North Yorkshire, North Lincolnshire and Doncaster all score 67 too, so the county is typical of its corner of England.

D

Median today

B

Median potential

Homes in band C or better45.3%

England and Wales 48.5%

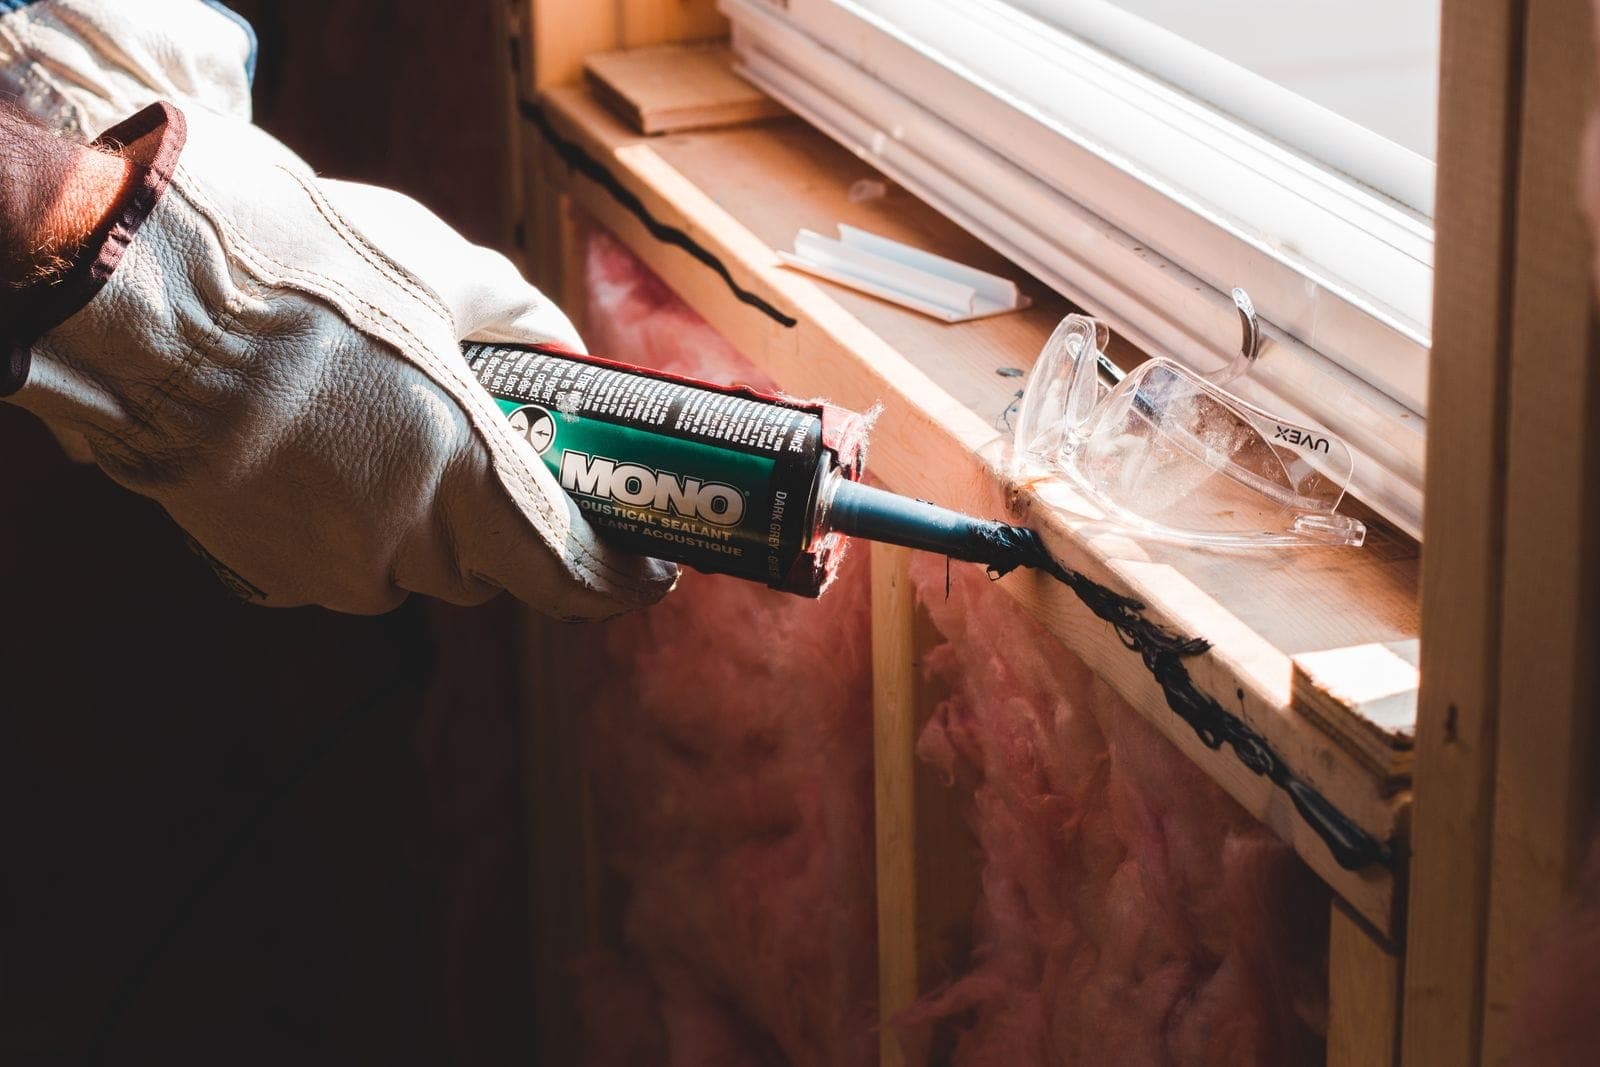
A gloved hand running a bead of acoustic sealant along a timber window sill, with safety glasses resting on the sill

Band spread against England and Wales

Bars are East Riding of Yorkshire. The rule on each track is England and Wales for that band.

England and Wales average

  1. A0.2%
  2. B16.9%
  3. C28.2%
  4. D37.7%
  5. E13.1%
  6. F3%
  7. G0.9%

ONS figures for 2024, over homes with a certificate. The median score is from the EPC register.

Heat pumps and solar

What East Riding of Yorkshire is fitting

With 212 heat pumps per 10,000 homes and 702 solar installations per 10,000 households, the East Riding is ahead of the typical council on both. North Lincolnshire leads the neighbours on solar with 1,080, and North Yorkshire on heat pumps with 338. A south-facing roof here makes 978 kWh a year per kilowatt, a little under the middle council's 1,006.

Heat pumps per 10,000 homes

East Riding of Yorkshire: 212, joint 109th highest of 361. The middle council: 125.

  1. North Yorkshire338
  2. East Riding of Yorkshire212
  3. North Lincolnshire162
  4. York109
  5. Doncaster76
  6. Hull26

Homes whose latest certificate names a heat pump as the main heating, per 10,000 homes with a certificate.

Solar installations per 10,000 households

East Riding of Yorkshire: 702, 127th highest of 361. The middle council: 596.

  1. North Lincolnshire1,080
  2. North Yorkshire838
  3. Doncaster719
  4. East Riding of Yorkshire702
  5. York592
  6. Hull327

Solar installations of every size (DESNZ), per 10,000 households. A few are on businesses, not homes.

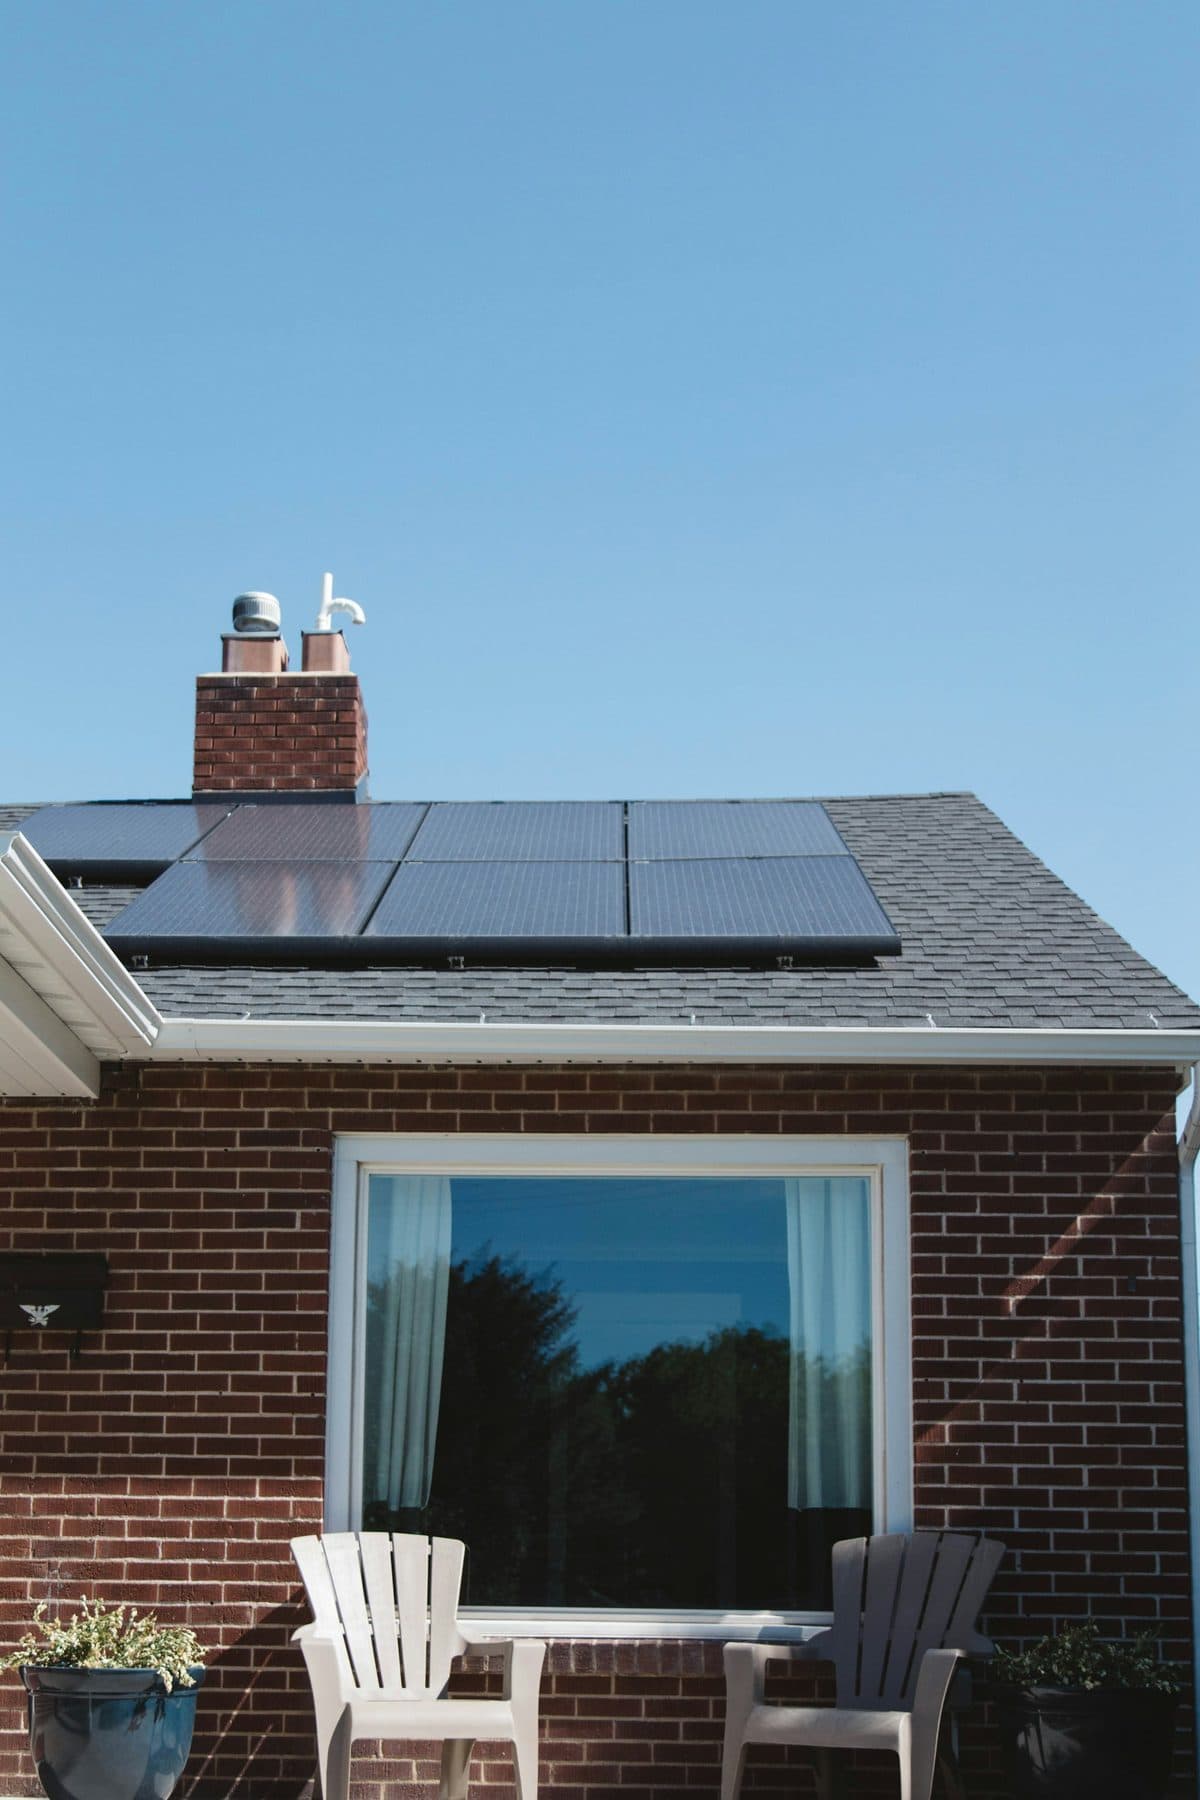
A brick bungalow with a row of solar panels on its roof and a chimney beside them, under a clear sky

Solar in East Riding of Yorkshire

A 4 kWp array on a roof here

What it makes a year by the way the roof faces, what that's worth at 26.3p a unit and 12p for exports, and how long it takes to cover the EPC method's £8,000–£10,000.

Solar generation, value and payback in East Riding of Yorkshire by roof direction
Roof facesMakes a yearWorth a yearPays back in
south3,911 kWh£66512–15 years
south-east3,694 kWh£62813–16 years
south-west3,648 kWh£62113–16 years
east3,098 kWh£52715–19 years
west3,036 kWh£51716–19 years

Generation is PVGIS for this council at a 35° pitch. The value assumes 35% is used in the house and the rest exported (Outgoing Octopus). The cost is the EPC method's standard figure, not a quote. How the payback is worked out.

Costs

What the work costs

These are national figures, not East Riding of Yorkshire ones. Nothing published gives installed cost by area, so we don't invent a local premium: labour, access, parking and travel do move the price, and we will show by how much when quote data can.

National installed costs by measure
MeasureTypical costWhere it comes from
Air source heat pump£11,128–£15,627Boiler Upgrade Scheme, middle half of jobs
Solar panels£8,000–£10,000EPC method
Cavity wall insulation£900–£1,500EPC method
Solid wall insulation£7,500–£11,000EPC method
New gas boiler£2,200–£3,500EPC method
Loft insulation£900–£1,200EPC method

The EPC method's figure is the range the middle recommendation was given — the same for every home, so a guide rather than a quote. The heat pump figure is what Boiler Upgrade Scheme installers reported, with the grant still in it.

Installers

MCS certified installers near East Riding of Yorkshire

96 certified installers based nearby say they cover East Riding of Yorkshire. Here are the nearest, favouring those with a website, including one who fits heat pumps under the Boiler Upgrade Scheme and one who fits solar.

  • Covering East Riding of Yorkshire

    96

    32 of them based in the council

  • Fit heat pumps

    21

    19 registered for the Boiler Upgrade Scheme

  • Fit solar panels

    81

  • Fit batteries

    57

From the MCS register, as it stood on 22 September 2026. Nobody pays to appear here. Certification says an installer may do the work, not how well they do it, so get three quotes against the same written scope. How to check an installer

Check your home

Enter your postcode and pick your address. We'll show what its energy certificate says, what would suit it and which grants apply.

Get quotes from installers

Free, from up to 3 installers who cover your postcode. They pay us a fee; you don't have to go ahead.

Questions

Upgrading a home in East Riding of Yorkshire

What households here ask most, answered from this council's own figures.

Do I need planning permission for a heat pump in the East Riding of Yorkshire?

Usually not: most heat pumps and solar panels are permitted development. The rules are tighter in a conservation area, and the East Riding has 8.3 per 10,000 households, 41st highest of 296 councils. When an application is needed, the council decides 99% in time.

How can I cut heating costs in an East Riding bungalow?

Start with the loft, since a bungalow has a lot of roof for its size. 17.6% of East Riding homes are bungalows and 16.3% of lofts here have under 100 mm of insulation. After that, check for an empty cavity, then the heating.

Why are energy costs high in the East Riding of Yorkshire?

The certificates estimate £1,110 a year per East Riding home, 71st highest of 361 councils, against £1,004 for the typical one. More detached homes and more oil heating than most play a part. It's the certificates' estimate at the prices when they were lodged, not a real bill.

Are heat pumps common in the East Riding of Yorkshire?

More than in most councils. The East Riding's certificates record 212 heat pumps per 10,000 homes, against 125 for the typical council, and 50 households in every 10,000 have had a Boiler Upgrade Scheme grant, against 31.

I heat with oil in the East Riding of Yorkshire. Should I switch?

It's worth looking at. 5.8% of East Riding homes use oil, against 1.1% for the typical council, and homes on oil usually have the most to gain from changing the heating. 17.1% of homes here are off the gas grid.

Go from East Riding of Yorkshire to your own address

A council's figures are a starting point. A postcode gets the property's own record: its age, construction, current rating and what it could reach.